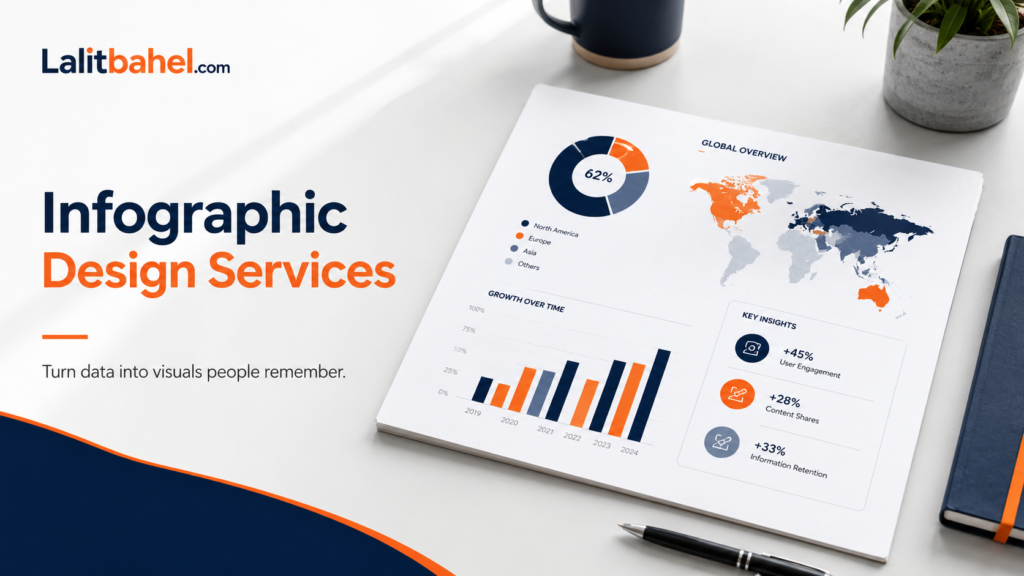
Infographic Design Services: How to Turn Complex Data Into Content That Gets Shared, Cited, and Remembered
An infographic is not a chart with a logo on it. Done well, an infographic is a persuasion tool that combines data, narrative, and visual design to communicate something that would take paragraphs of text to convey—in a format that can be absorbed in under a minute and shared in a single click. Done poorly, it’s visual noise that wastes everyone’s time and dilutes your brand credibility.
The difference between an effective infographic and an ineffective one isn’t the quality of the data. It’s the quality of the design: information hierarchy that guides the eye, visual representation that clarifies rather than decorates, and a narrative structure that builds from hook to insight to action. These are design skills, and when they’re applied well, infographics can become among the most valuable content assets a business creates.
This guide covers what professional infographic design services include, the different types of infographics and their best use cases, how the design process works, and what to look for when briefing or evaluating infographic work.
“The purpose of visualization is insight, not pictures.” — Ben Shneiderman
Why Infographics Are Worth the Investment
The case for professional infographic design comes down to four documented advantages:
Comprehension Speed
Research consistently shows that visual information is processed significantly faster than text. The human brain processes images in approximately 13 milliseconds and retains visual information far longer than equivalent textual information. For content that needs to communicate quickly—social media, presentations, marketing materials, sales enablement—visual formats have a structural advantage over text-only alternatives.
Shareability
Original data visualizations and well-designed infographics are among the most shared content types in B2B and B2C marketing. They’re shareable because they offer genuine utility (the data is useful) in a format that’s easy to consume and easy to pass along. A 2,000-word research report becomes an infographic that gets shared; the research report itself rarely does.
Citation and Backlink Generation
Infographics based on original research or compelling data curation attract citations from journalists, bloggers, and industry analysts. When your infographic is cited, your data becomes visible to audiences you couldn’t have reached directly—and the citation often includes a backlink to your website, building SEO authority alongside brand reach.
Content Repurposing Efficiency
A well-constructed infographic is a content repurposing asset. The data, narrative sections, and key statistics can be extracted and reused as social media cards, blog post graphics, presentation slides, email newsletter assets, and print collateral. The initial design investment multiplies across many content applications.
The Seven Types of Infographics and Their Best Use Cases
What Professional Infographic Design Services Include
Data Analysis and Insight Identification
Many infographic design services begin with data review: understanding what the source data actually shows, identifying the most significant or surprising insights, and determining which data points merit visual prominence. This step is frequently undervalued but is critical: the best infographic design cannot save an infographic built around the wrong insights.
Narrative Structure Development
An infographic needs a narrative arc: a hook that captures attention, a logical sequence of information that builds understanding, and a conclusion that delivers the key takeaway. The structural template for effective infographic narrative: context → problem or question → data evidence → insight → implication. The designer should participate in structuring the narrative, not just execute on a slide-by-slide brief.
Visual System Design
The visual system defines how the infographic will look: color palette, typography, icon style, chart style, layout grid, and any illustrative elements. For branded infographic work, this system should derive from the company’s visual identity guidelines. For standalone infographic campaigns, the designer may develop a specific visual system for the content.
Data Visualization
The charts, graphs, maps, and diagrams that represent quantitative information. This is the most technically demanding component of infographic design—poorly executed data visualization actively misleads audiences. Common failures: y-axes that don’t start at zero (misleading magnitude), pie charts with too many segments (unreadable), bar charts with inconsistent color use that implies meaning that doesn’t exist.
Custom Iconography and Illustration
Supporting visual elements that make abstract concepts concrete, add visual interest, and provide navigational cues within the infographic. Icon quality matters significantly: mismatched icon styles within a single infographic signal that the design was assembled rather than conceived as a unified whole.
Final Production Files
Professional infographic deliverables include the native design file (Adobe Illustrator, Figma), a web-optimized version (PNG or SVG at appropriate dimensions), a print-ready version (PDF at 300dpi or higher), and social media crop versions for the primary platforms. Without these formats, usage is restricted.
The Infographic Design Process
Step 1: Data and Brief Review (Day 1–2)
The designer reviews all source data, the target audience, and the intended distribution channels. Key questions to answer at this stage:
- What’s the single most important insight this infographic should communicate?
- Who is the primary audience and how much context do they have?
- Where will this be distributed (website, social, email, print, all)?
- What format and dimensions are required?
- What brand guidelines apply?
- What’s the intended action (share, download, contact, remember)?
Step 2: Content Architecture (Day 2–3)
The designer structures the information: which data points are included, in what order, with what level of visual weight. A wireframe or content outline is delivered for client approval before design begins. Changes to content structure are cheap at this stage; they’re expensive after the full design is complete.
Step 3: Design Draft (Day 3–7, depending on complexity)
The full infographic is designed. Statistical infographics with custom data visualization typically take longer than process or list infographics of the same length. Custom illustration adds 2–3 days.
Step 4: Revision Rounds
Standard infographic packages include 2–3 revision rounds. Effective revision feedback addresses one layer at a time: structure and content accuracy first, visual direction second, detail polish third. Combining all feedback in a single pass produces faster results.
Step 5: Final Files and Social Derivatives
The completed infographic plus all format variants is delivered. Effective designers also deliver 3–5 social media crops (square, landscape, portrait) at optimal platform dimensions—Instagram, LinkedIn, Twitter/X, Pinterest all have different optimal sizes, and a single layout doesn’t work equally well across all of them.
Infographic Design for Different Business Contexts
Marketing Infographics
Built for brand awareness, lead generation, and content marketing. Primary distribution: website blog posts, email newsletters, social media, PR. These infographics prioritize shareability and visual impact over data density.
Sales Enablement Infographics
Built for sales conversations, leave-behinds, and email follow-ups. Primary distribution: PDF attachments, sales deck inserts, printed collateral. These infographics prioritize information hierarchy and clarity of the value proposition. For print and marketing material design, see the marketing and print design service.
Internal Communication Infographics
Built for employee communication, training, and process documentation. Primary distribution: company intranet, email, presentations, printed posters. These prioritize clarity and memorability over aesthetic ambition.
Report and Research Infographics
Built for publishing original research, survey results, or market analysis. Primary distribution: downloadable PDF, website landing page, press kit. These prioritize data integrity and professional authority.
Common Infographic Design Mistakes
Too Much Data
Every data point added to an infographic reduces the impact of every other data point. The discipline of infographic design is ruthless prioritization: include only the data that directly supports the key narrative. A 5-data-point infographic with a clear story performs better than a 25-data-point infographic that tries to include everything.
Decoration as Data Visualization
Icons, illustrations, and decorative elements have legitimate roles in infographic design—as navigational aids, conceptual representations, and visual interest. They don’t work as substitutes for actual data visualization. An infographic that represents numerical data with proportional icons instead of a properly calibrated chart is prioritizing aesthetics over accuracy.
Missing the Distribution Context
An infographic designed for a 24-inch monitor display will fail as a social media post. An infographic designed for print at A3 size will be illegible as a web embed at 800px wide. Distribution channel should inform format, dimensions, and text size from the earliest design stage.
No Clear Call to Action
Every business infographic should have a clear “what next”—a URL, a contact mechanism, or a specific next step that converts audience attention into business action. An infographic without a CTA is marketing without a purpose.
For content and social media design that extends infographic strategy into a full content system, see the content and social media design service. For the broader visual identity system that infographics should align with, see the brand identity design services guide.
Turn Your Data Into Content That Does Real Work
The right infographic can take research or data you already have and turn it into content that generates backlinks, gets shared, attracts press, and keeps working for months after publication. Let’s design yours.